Advanced Techniques in Microsoft Excel for Business and Financial Applications – Intermediate / Advanced Course

Advanced Techniques in Microsoft Excel for Business and Financial Applications – Intermediate / Advanced Course
This course is an intermediate skill Microsoft Excel Course - Intermediate Training contains all formulas that are required to be known in all business and Marketing applications - jobs. It can be very useful for those who just finished the university studies and looking to increase their skills in data visualization – reporting and usages of data sheets. Only relevant and essential exercises that you will need to know in work. It will require a good understanding of basic Excel knowledge.
Materials are recorded with Excel 2010 but work in 2013 and 2016 furthermore most functions also work in the 2007 version.
We will guide you step by step through the Intermediate Microsoft Excel formulas to advanced level and beyond. You will start with the basics, building a solid foundation that will give you further knowledge as you progress into the more advanced level topics, array functions.
You are going to discover a whole range of skills and techniques that will become a standard component of your everyday use of Excel. In this course, you will build a solid layer of more advanced skills so you can manage large datasets and create meaningful reports. These key techniques and tools will allow you to add a sophisticated layer of automation and efficiency to your everyday tasks in Excel.
In this course we will: Learn how to import data from different sources, create mashups between data sources, and prepare data for analysis. After preparing the data, find out how business calculations can be expressed using the DAX calculation engine. See how the data can be visualized and shared to the Power BI cloud service, after which it can be used in dashboards, queried using plain English sentences, and even consumed on mobile devices. What you'll learn Below are just a few of the topics that you will master.
|
Excel is one of the most widely used solutions for analyzing and visualizing data. It now includes tools that enable the analysis of more data, with improved visualizations and more sophisticated business logic.
Some Excel functions are more powerful than others and some are more relevant to the CPA than others. For example, most CPAs will find the IF, SUM, COUNT, SUBTOTAL, TEXT, and VLOOKUP are very relevant to the CPA while other engineering and trigonometry functions such as LOG, PI, RADIENS, DELTA, TAN, COMPLEX, and HAX2DEC are typically less relevant to CPAs. It has been my experience that the following 67 functions are most relevant to the CPA; therefore CPAs wishing to increase their command of Excel functions should concentrate on these functions first.
This course gives you a deep, 100% comprehensive understanding of Excel's latest data manipulation and visualization tools and techniques. I'll show you when, why, and how to use each function and all chart type, introduce key data visualization best practices, and guide you through interactive, hands-on demos and exercises every step of the way.
__________
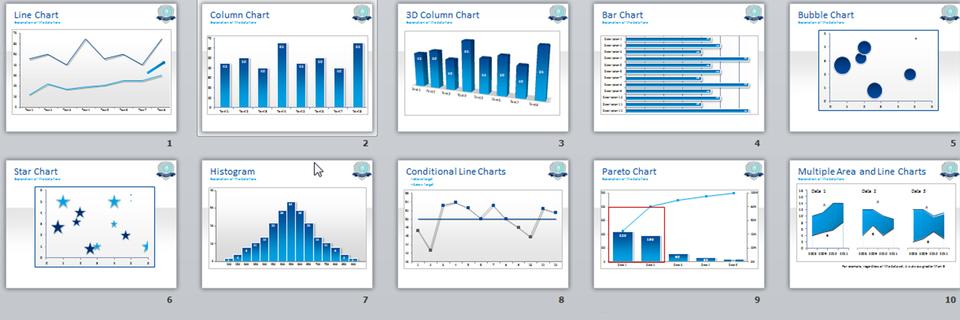
We'll kick things off by exploring each of the 20+ chart types that Excel 2016 (specifically Office 365) has to offer, including:
- Bar & Column charts
- Histograms & Pareto charts
- Line charts & trend lines
- Area charts
- Pies & Donuts
- Scatter plots & Bubble charts
- Box & Whisker charts
- Tree Maps & Sunbursts
- Waterfall & Funnel charts
- Radar & Stock charts
- Heat maps, 3-D Surface & contour charts
